Reading Execution Plans, Part 1: Introduction
I want to start off with a quote I read on Reddit a while ago, which I think is a very appropriate introduction to what we're going to talk about:
The reality is that this is how most of us operate with regards to SQL. Think about it: how often do you sit and consider how the SQL server works, or how it is providing data back to you as the user? If you're anything like me, most of the time, the server is treated like an orb of data, to which we incant certain ritual phrases (select *), and magically receive data in less than a blink of an eye.

But, the SQL server is not actually a piece of magic. It is software, like any other, limited by the same constraints of physics and algorithms that limit any other piece of software. The difference is that the SQL optimization engine is really impressive at figuring out the best way to deliver the data you asked, so that it can do less work than one would expect.
Let me give you an example. Take the simple query: select * from SalesOrders so inner join SalesOrderDetails sod on so.OrderId = sod.OrderId. If both tables have less than 1,000 rows, it really doesn't matter how the data is collected. On the other hand, if the SalesOrders table has 100,000 orders and the SalesOrderDetails table has 1,000,000 details, then how the data is collected makes a huge difference.
Say we take the dummy route and iterate the SalesOrderDetails table looking for the right OrderId for every record in the SalesOrder table. Then it would iterate up to 100_000 * 1_000_000 = 100_000_000_000 times to return the data it needs. However, if we can be smart and manipulate the data so that both record sets are sorted by OrderId, then we can do what's called a MERGE JOIN, which will only require iterating max(100_000,1_000_000) = 1_000_000 records to return the exact same dataset. I don't know about you, but fixing 5 orders of magnitude before even starting the query is pretty impressive to me.
Sometimes, however, you'll find yourself facing a query that inexplicably takes 5 minutes to run. The server was unable to find a fast way to retrieve the data, whether because the index doesn't exist or because the query doesn't use the right index or because the optimizer accidentally chose a bad way to query the data. Thankfully, there is a way to peer inside the magic orb of data, to find out what is really happening, in the form of the execution plan.
What are execution plans?
After the server parses the query, the parsed representation is handed to the optimizer, which is the most important part of the execution process. The optimizer will evaluate how to process the data, i.e. which tables does it need to access, which index would be best to retrieve the data, which type of join would be quickest, etc.
To give an idea of how hard this process is, even a relatively simple query involving five tables has 120 different potential ways to describe which table should collect data first, second, etc. Then there are three different join types which must be considered, along with which index on each table. From this, the server needs to determine in roughly 25ms or so the best way to query the data.
The finished result of the optimization step is the execution plan: a description from start to finish of how the data will be retrieved, processed, joined, and returned to the client. It is a tree of nodes, each of which is a defined action that the server will take.

Basics of Reading an Execution Plan
There are two important things to know in order to read an execution plan: the order of execution, and how the nodes themselves get executed. The initial reaction upon viewing an execution plan is to assume that the data is first collected in the data nodes on the right side and then traversed through nodes to the left. While this is the way that data flows, the execution actually operates in the opposite direction.
Execution Flow
Execution moves from left to right, top to bottom; starting at the SELECT node. There are several benefits to this, starting with the notion that there is no reason to execute nodes for data that will never be needed or used. If early data nodes prove that no records can be returned by the query, due to filters excluding all records, then the remaining nodes of the query can be skipped entirely and the query can be completed earlier.
The other advantage this provides is that some nodes can be executed more than once, if it would be faster to execute the node (or sub-tree) once for each provided input instead of executing for all of the data in a particular node and filtering that data later.
Execution Process
The easiest way to interpret how each node gets executed is to see them as iterator functions in C#, or generator functions in ES6. Instead of a node running until it has completely drained of data, each node returns one record at a time, in a lazy fashion. Unless a node buffers data as part of it's operation, like a SORT node, a single record may pass through every node and to the client before a second record is requested. This will become more apparent as we discuss what each node does, but keep in mind that when data moves from node to node, it does so as individual records.
How do we view the execution plan?
One last thing before we get into each of the individual nodes: How do we peer inside the magic orb? There are three different ways to view the execution plan for a query: before the query is run; as the query is running; and after the query has finished. 1
Estimated Execution Plan
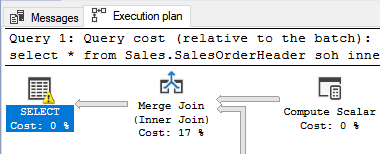
If you want to see the execution plan before actually running the query, you can click the "Display Estimated Execution Plan" button in the toolbar. This will submit the query to the server as if the query was going to be executed, and stop before actually starting the query.
The estimated plan will be shown in the results area as an Execution Plan tab
Streaming Execution Plan
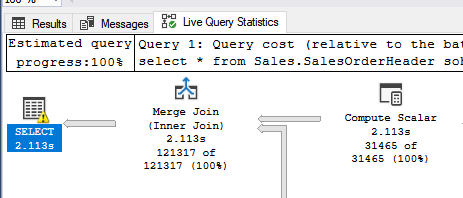
Live Query Execution requires SQL Server 2016 or later, and SSMS 2016 or later. It is a toggle button in the toolbar, shown here.
If the toggle is set when a query is run, then a new tab will appear in the results area, which will show the execution plan and how data is currently flowing through each node on the server.
Actual Execution Plan
This is also a toggle button in the toolbar, which if set, will show the execution plan for the query after the query has completed.
Caveat. From here on out, everything presented is specific to Microsoft SQL Server. However, the concepts are similar in most relational SQL servers, such as MySQL, PostgreSQL and Oracle. ↩


